Single-Cell Resolution for Transcriptional and Regulatory Discovery
Epigenome Technologies runs validated single-cell RNA-seq, ATAC-seq, and multiome workflows generating high-quality cell-type-specific expression profiles, chromatin accessibility maps, and integrated regulatory landscapes. We qualify inputs, run the benchwork, and deliver interpretable outputs that drive the next phase of your research.
scRNA-seq
Cell-Type Resolution
scATAC-seq
Regulatory Elements
Multiome + Spatial
Integrated Landscapes
Choose the right single-cell profiling method
| Service | Cat. No | Input Requirements | Best For | Inquiry |
|---|---|---|---|---|
| scRNA-seq (3' or 5') | SCRNA-301 | 500 to 100K cells/sample | Cell-type identification, differential expression, multiple platforms | Quote |
| scATAC-seq | SCATC-302 | 1K to 100K nuclei/sample | Regulatory element discovery, open chromatin, multiple platforms | Quote |
| Multiome (ATAC+RNA) | MULTI-303 | 1K to 10K nuclei/sample | Integrated regulatory landscapes; 10X Chromium or BD Rhapsody | Quote |
| Spatial RNA (Takara Trekker) | SPRNA-304 | Fresh-frozen tissue sections | Tissue architecture, cell-cell interactions | Quote |
| Spatial Multiome (Takara Trekker) | SPMLT-305 | Fresh-frozen tissue sections | Spatial regulatory landscapes | Quote |
Why single-cell resolution?
Single-cell profiling reveals insights bulk measurements obscure—cellular heterogeneity within tissues and disease states, rare population identification (immune infiltrates, stem cell niches, drug-resistant clones), developmental trajectories and lineage commitment decisions, and regulatory mechanisms linking chromatin state to transcriptional output at single-cell resolution.

Common applications
- Tumor microenvironment profiling with spatial architecture of tumor-immune interfaces
- Developmental biology: lineage trajectory inference and spatial organization of developmental niches
- Rare population discovery: stem cell niches, drug-resistant clones, transitional cell states
- Regulatory mechanism mapping: enhancer-gene linkage and TF activity inference
- Biomarker discovery: cell-type-specific markers for diagnostics and patient stratification
- Tissue architecture and cell-cell interactions using Takara Trekker spatial profiling
Included with every engagement
- Joint design sessions align sample availability, platform selection (10x Genomics, BD Rhapsody, Takara Trekker), and QC thresholds
- Project scientists embedded through cell calling, clustering, and interpretation
- Standard clustering and differential expression/accessibility analysis included
- Custom trajectory inference, RNA velocity, spatial neighborhood analysis available on request
- Integration briefs consolidate single-cell data with bulk or third-party datasets
scRNA-seq: Cell-Type Identification and Transcriptional State Mapping
Single-cell RNA sequencing quantifies transcript abundance at single-cell resolution, revealing cellular heterogeneity, rare populations, and developmental trajectories that bulk measurements obscure. We deploy 10x Genomics Chromium (3' and 5' chemistry) and BD Rhapsody platforms for transcriptome-wide or targeted profiling, with FFPE-compatible workflows for archival specimens.

Best for
- Cell-type identification and annotation in complex tissues
- Rare population discovery (immune subsets, cancer stem cells, resistant clones)
- Differential expression analysis across conditions or time points
- Trajectory inference and lineage commitment mapping
- Fresh cells, cryopreserved PBMC, dissociated tissues, or FFPE specimens
Compatible samples
- Cell lines
- Cryopreserved tissues or cells
- Flash-frozen tissues (nuclei)

QC metrics
- Cell recovery: 500–10,000 cells per sample
- Reads per cell: 20,000–50,000 (3' GEX), 50,000–100,000 (5' GEX)
- Genes detected: >1,000 per cell (median)
- Mitochondrial percentage: <10% (quality threshold)
- Replicate correlation > 0.90

Workflow
-
Plan
Sample qualification with viability assessment, platform selection (10x or BD Rhapsody), and sequencing depth determination.
-
Partition & barcode
Cell encapsulation, barcoding, and reverse transcription with integrated debris filtering and doublet detection.
-
Library construction
cDNA amplification and library prep (3' or 5' chemistry) with QC on yield, fragment size, and complexity.
-
Sequence & analyze
NovaSeq or NextSeq sequencing, followed by cell calling, clustering, differential expression, and trajectory inference.
Deliverables
- FASTQ files and cell-barcode matrices
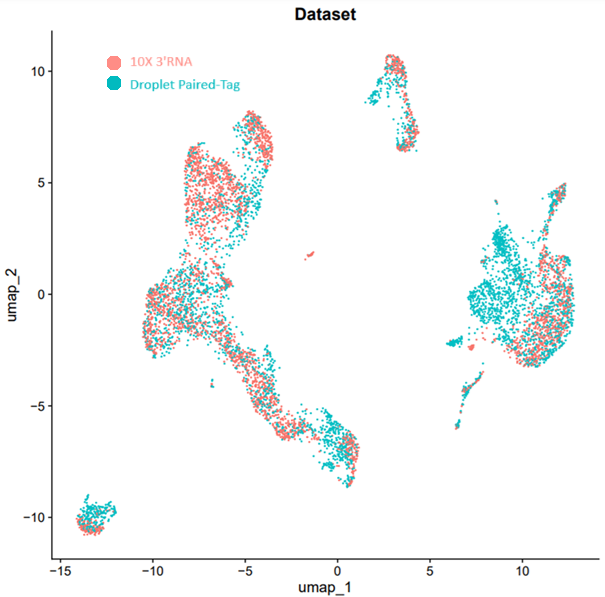
- UMAP/t-SNE embeddings with cell-type annotations
- Differential expression tables with marker gene lists
- QC reports: cell recovery, reads per cell, genes detected, mitochondrial percentage
- Optional trajectory inference, RNA velocity, integration with external datasets
Advantages
- Transcriptome-wide profiling without prior gene selection
- Rare population discovery at single-cell resolution
- Compatible with fresh, cryopreserved, and FFPE samples
- Flexible platforms: 10x Chromium, Illumina PIPSeq
- Trajectory inference reveals developmental and disease progression dynamics
scATAC-seq: Single-Cell Chromatin Accessibility Profiling
Single-cell ATAC-seq maps chromatin accessibility at single-cell resolution, revealing regulatory element activity, TF binding motifs, and chromatin state heterogeneity across cell types. We use 10x Genomics Chromium ATAC workflows to profile genome-wide accessibility, identifying cell-type-specific enhancers and silencers that drive transcriptional programs.
Best for
- Regulatory element discovery at single-cell resolution
- TF motif enrichment and binding site prediction
- Chromatin state heterogeneity across cell types
- Gene activity scoring without RNA measurement
- Nuclei from frozen samples, fresh tissues, or dissociated cells

QC metrics
- Nuclei recovery: 1,000–10,000 per sample
- Reads per nuclei: 10,000–25,000 (median)
- TSS enrichment: >7
- Fraction of reads in peaks (FRiP): >0.20
- Pseudobulk peak concordance with bulk ATAC-seq


Workflow
-
Plan
Nuclei isolation protocol optimization, sample qualification with debris assessment, and sequencing depth planning.
-
Partition & transpose
Nuclei encapsulation, barcoding, and tagmentation with integrated QC on nuclei quality and transposition efficiency.
-
Library construction
Amplification and library prep with QC on fragment size distribution (nucleosomal ladder) and complexity.
-
Sequence & analyze
NovaSeq sequencing, followed by cell calling, peak calling, motif enrichment, gene activity scoring, and clustering.
Deliverables
- FASTQ files and peak-by-cell matrices
- Cell-type-specific peak sets with accessibility scores
- TF motif enrichment analysis per cluster
- Gene activity scores linking accessibility to expression
- QC reports: TSS enrichment, FRiP, fragment size distributions, pseudobulk concordance
Advantages
- Genome-wide accessibility profiling without prior target selection
- Cell-type-specific regulatory element identification
- TF activity inference through motif enrichment
- Compatible with frozen samples and nuclei isolation
- Gene activity scores provide transcriptional predictions without RNA-seq
Multiome (ATAC+RNA): Integrated Chromatin and Expression Landscapes

Best for
- Integrated regulatory landscapes linking chromatin to expression
- Enhancer-gene correlation and linkage analysis
- Joint clustering revealing chromatin-expression concordance
- TF activity inference validated by target gene expression
- Mechanistic studies requiring both layers from the same cell

QC metrics
- Nuclei recovery: 1,000–10,000 per sample
- ATAC reads per nuclei: 10,000–25,000
- RNA reads per nuclei: 20,000–50,000
- ATAC TSS enrichment >7, FRiP >0.20
- RNA genes detected >1,000, mitochondrial % <10%

Workflow
-
Plan
Nuclei isolation optimization, sample qualification, and dual-modality sequencing depth planning (ATAC + RNA).
-
Partition & profile
Nuclei encapsulation with simultaneous ATAC tagmentation and RNA capture from the same cell, with integrated barcoding.
-
Library construction
Separate ATAC and RNA library prep from barcoded material with QC on both modalities (fragment size, yield, complexity).
-
Sequence & integrate
Dual sequencing (ATAC + RNA), followed by joint cell calling, clustering, enhancer-gene linkage, and integrated analysis.
Deliverables
- FASTQ files and dual matrices (ATAC peak-by-cell, RNA gene-by-cell)
- Joint UMAP embeddings demonstrating chromatin-expression concordance
- Enhancer-gene correlation matrices and linkage predictions
- TF activity scores validated by target gene expression
- Integrated QC reports covering both ATAC and RNA modalities
Advantages
- Paired chromatin and expression from the same cell eliminates ambiguity
- Direct enhancer-gene linkage without computational inference
- TF activity validated by downstream target expression
- Joint clustering reveals regulatory mechanisms driving cell states
- Single workflow captures both regulatory layers efficiently
Spatial RNA/Multiome: Tissue Architecture and Cell-Cell Interactions
Takara Trekker spatial profiling captures spatially-resolved RNA or multiome (ATAC+RNA) data from fresh-frozen tissue sections, preserving native tissue architecture and enabling cell-cell interaction analysis, neighborhood enrichment, and spatial gene expression gradients. We deploy Trekker workflows for tumor microenvironment mapping, developmental niche characterization, and spatial regulatory landscape profiling.
Best for
- Tumor microenvironment mapping with spatial immune infiltrate characterization
- Developmental niche organization and spatial lineage transitions
- Cell-cell interaction networks and ligand-receptor signaling
- Spatial gene expression gradients and neighborhood effects
- Tissue-level chromatin dynamics with spatial multiome profiling
Pixel-free Spatial Resolution

QC metrics
- Cell/Nuclear Capture: 10K/lane, up to 60% of all cells
- Cells individually labeled, no spots or pixels
- Tissue morphology preservation and alignment to H&E imaging
- Spatial correlation with known anatomical landmarks
Workflow
-
Plan
Tissue section preparation, cryosectioning optimization, and quality assessment with H&E staining.
-
Capture & barcode
Spatial capture on Takara Trekker slides with spatially-barcoded spots, followed by tissue permeabilization and RNA/ATAC capture.
-
Library construction
Spatial library prep (RNA or multiome) with QC on capture efficiency, spot-level yield, and tissue morphology preservation.
-
Sequence & map
NovaSeq sequencing, followed by spatial mapping, cell-type deconvolution, neighborhood enrichment, and cell-cell interaction analysis.
Deliverables
- FASTQ files and spatial gene/peak expression matrices
- Tissue section overlays with gene expression or accessibility heatmaps
- Spatial cell-type mapping and deconvolution
- Neighborhood enrichment analysis and cell-cell interaction networks
- H&E imaging aligned to spatial transcriptome data
Advantages
- Preserves native tissue architecture and spatial context
- Cell-cell interaction analysis without dissociation artifacts
- Spatial gene expression gradients reveal neighborhood effects
- Tumor microenvironment mapping with immune infiltrate localization
- Integrates with matched dissociated single-cell data
Partner with our scientists
Share your biological questions, sample availability, and study goals. We will return a scoped single-cell brief outlining recommended platform mix (scRNA-seq, scATAC-seq, multiome, or spatial), QC checkpoints, and downstream analysis.
- Sample requirements: Platform-specific inputs from 500 cells (scRNA-seq) to fresh-frozen tissue sections (spatial) with low-input contingencies available.
- Storage guidance: Fresh cells, cryopreserved PBMC, dissociated tissues, nuclei from frozen samples, or fresh-frozen tissue sections accepted with documented handling.
- Data options: Raw FASTQ, processed matrices, clustering, differential analysis, and interpretive outputs available individually or bundled.
- Support: Project scientists provide experimental planning and guidance, data reviews, and troubleshooting.